Why Is Global Wine Sourcing Growing Worldwide?
Global wine sourcing is expanding because buyers now seek broader choice, steadier supply, and stronger value across borders. The phrase wine global reflects this shift from local purchasing toward coordinated international supply networks. Importers can compare harvest conditions, grape varieties, certifications, logistics, and prices across several producing regions.
The numbers reveal a more complicated story. The International Organisation of Vine and Wine (OIV) reported approximately 237 million hectolitres of global production in 2023, while consumption reached about 221 million hectolitres. Internationally traded wine accounted for roughly 45% of consumption by volume, showing how deeply cross-border sourcing shapes the market. That share is significant.
The OIV’s State of the World Vine and Wine Sector 2024 also described 2023 as a difficult year, with production affected by extreme weather in major vineyards. A late frost in Europe, drought in parts of the Southern Hemisphere, and transport disruption can change a purchasing plan within weeks. Buyers therefore source from countries such as France, Italy, Spain, Chile, Australia, South Africa, and New Zealand to reduce concentration risk.
Commercial experience adds another layer. Sourcing teams increasingly evaluate bottle weight, shipping routes, currency exposure, sustainability claims, and supplier traceability—not only tasting notes. IWSR market analysis continues to highlight changing consumer preferences, premiumisation, and growth in alternative purchasing channels. However, global sourcing is not automatically more efficient. Longer journeys can increase emissions, paperwork, and quality risks. The industry still needs better data, clearer standards, and honest measurement. A wider supplier map helps, but it does not replace careful judgment.
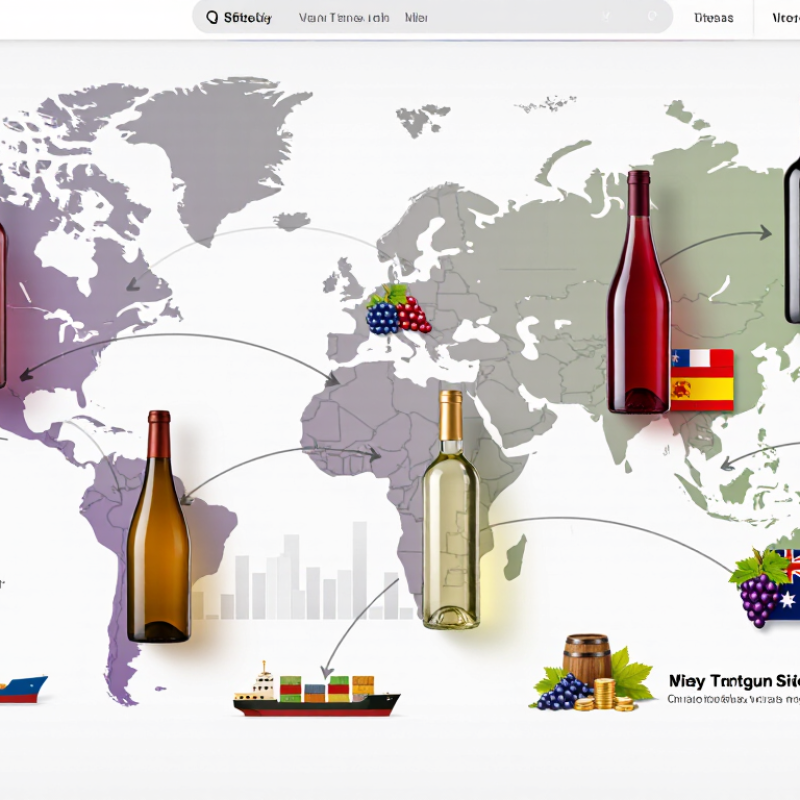
Global Wine Sourcing Explained: A €36.1 Billion International Trade in 2023
Why Is Global Wine Sourcing Growing Worldwide?
Global wine sourcing is no longer limited to traditional producing regions. In 2023, international wine trade reached approximately €36.1 billion, according to the International Organisation of Vine and Wine (OIV). Trade volume was about 99.3 million hectolitres, while the average export price reached nearly €3.64 per litre.
The figures reveal an important shift. Buyers increasingly source wine across several climates, harvest periods, and production styles. A restaurant group may compare a cool-climate white wine with a warmer regional alternative before finalising its menu. Importers also use multiple origins to manage supply gaps, currency changes, and uneven harvests. This is practical sourcing, not simply wider choice.
Digital procurement has made this process faster. Customs databases, laboratory testing, and electronic traceability records help buyers check origin, alcohol levels, packaging, and compliance before shipment. The International Trade Centre and UN Comtrade provide detailed product and trade-value data, supporting more informed negotiations. Still, data is not perfect. Reported values can vary with product categories, freight terms, and exchange rates. That limitation deserves attention.
Weather remains another powerful factor. OIV reported that global wine production fell sharply in 2023, reaching one of its lowest levels in decades. When vineyards face heat, drought, or heavy rain, international sourcing can protect continuity. Yet broader sourcing may increase transport emissions and quality-control costs. More options do not automatically mean better decisions.
Production Gaps: OIV Recorded 237 Million hL of Wine Worldwide in 2023
Global wine sourcing is growing because production and consumption no longer align neatly. The International Organisation of Vine and Wine (OIV) recorded only 237 million hectolitres of wine worldwide in 2023. That was about 10% below 2022 and the lowest global production level since 1961. Vineyards faced drought, frost, heat, and irregular rainfall. A dry spring in one region can quickly affect bulk availability months later.
Demand remains geographically uneven. OIV estimated global wine consumption at approximately 221 million hectolitres in 2023. Established markets still require diverse styles, while emerging markets increasingly seek imported choices. USDA Foreign Agricultural Service reports also show how harvest volatility can increase import dependence in individual countries. A distributor may therefore source from several regions, not one. This reduces supply risk when tanks run low or harvest volumes fall.
The physical details are practical. A buyer may compare acidity, alcohol, residual sugar, packaging weight, shipping distance, and delivery schedules. Price alone is not enough. Climate records and laboratory analysis matter too. The data is not perfectly neat. OIV figures are estimates, and national reporting methods can differ. Still, the production gap is clear. With less wine available in 2023, international sourcing became a resilience tool, not merely a commercial preference. This pattern may continue, although future harvests remain difficult to predict.
Global wine production declined from 260 million hectolitres in 2020 to an estimated 237 million hectolitres in 2023. This production gap is encouraging wineries and distributors to source wine across international markets to maintain supply and respond to regional shortfalls.
Source: International Organisation of Vine and Wine (OIV), State of the World Vine and Wine Sector reports. Figures are global production estimates excluding juice and must.
Demand Networks: Global Consumption Reached 221 Million hL in 2023
Global wine sourcing is expanding because consumption is no longer concentrated in a few traditional markets. In 2023, the International Organisation of Vine and Wine reported global consumption at approximately 221 million hL. That volume represents millions of bottles moving through restaurants, retailers, hospitality groups, and household cellars. Demand is distributed. Importers therefore seek supply from multiple climates and harvest calendars. This reduces dependence on one region when weather damages yields. It also gives buyers more flexibility in price, style, and packaging.
From an operational perspective, global sourcing requires more than finding available wine. Buyers assess laboratory results, origin records, storage conditions, freight routes, and delivery reliability. A shipment can lose value through heat exposure or delayed port handling. Small details matter. Experienced teams often use temperature monitoring and staged inventory planning to protect quality. These methods do not remove risk, especially when currency shifts or harvest forecasts change quickly.
The 221-million-hL figure also hides important differences between markets. Younger consumers may prefer lighter formats, while established buyers may prioritize provenance and vintage consistency. Local taxes, labeling rules, and drinking habits shape each route. Yet demand data is not perfect. Consumption estimates can lag behind informal sales, stock changes, or sudden economic pressure. That uncertainty should make sourcing more transparent, not more confident. Good decisions combine global statistics with direct market experience, verified suppliers, and honest review of failed shipments.
Why Is Global Wine Sourcing Growing Worldwide? - Demand Networks: Global Consumption Reached 221 Million hL in 2023
| Market or Region |
Wine Consumption
(million hL) |
Share of Global
Consumption |
Demand Network Significance |
| World |
221.0 |
100.0% |
Global benchmark for production, trade and sourcing decisions. |
| European Union |
107.8 |
48.8% |
The largest regional consumption base, supported by mature distribution and established wine culture. |
| United States |
33.3 |
15.1% |
The largest national wine market, creating demand for both domestic supply and international sourcing. |
| France |
24.4 |
11.0% |
A high-value mature market with strong demand across domestic and imported wine categories. |
| Italy |
21.8 |
9.9% |
A major consumer and producer market with extensive regional and cross-border supply links. |
| Germany |
19.1 |
8.6% |
A large, price-sensitive market where imported wine plays an important role in assortment depth. |
| United Kingdom |
12.8 |
5.8% |
A highly international market with broad reliance on imported wine and diversified sourcing routes. |
| Spain |
9.8 |
4.4% |
A significant European market connecting domestic production with regional trade and tourism demand. |
| Russia |
8.9 |
4.0% |
A sizeable national market whose supply mix is influenced by regional and international sourcing. |
| China |
6.8 |
3.1% |
A strategically important Asian market with demand shaped by urban consumers and imported wine channels. |
| Japan |
3.2 |
1.4% |
A developed Asian market with stable retail, hospitality and imported-wine demand. |
Source: International Organisation of Vine and Wine (OIV), State of the World Vine and Wine Sector in 2023. Figures are rounded estimates; regional totals include the national markets listed within them.
Supplier Diversity: 99.3 Million hL Crossed Borders Through Wine Trade in 2023
Why Is Global Wine Sourcing Growing Worldwide?
Supplier diversity is reshaping how wine moves across markets. In 2023, approximately 99.3 million hectolitres crossed international borders through wine trade. That volume equals billions of bottles moving between producing and consuming regions. It reflects wider sourcing choices, changing customer preferences, and improved logistics. Buyers can now compare harvest conditions, grape varieties, packaging formats, and delivery schedules from several origins.
The figure is impressive, but it is not a perfect picture. Trade volume does not reveal every quality difference, production cost, or environmental impact. Some shipments travel long distances before reaching a retail shelf. Others move through regional distribution hubs, making the final journey difficult to trace. Experienced buyers should examine customs data, technical sheets, laboratory results, and supply records before making decisions. Reliable documentation matters as much as attractive tasting notes.
Tips: Build a supplier shortlist by origin, volume, style, and delivery reliability. Request recent samples and compare them under the same conditions. Check vintage details, storage history, and packaging specifications. Keep a backup source for key categories. It may increase administrative work. Still, it can reduce disruption when weather, freight capacity, or harvest yields change. Supplier diversity works best when selection remains disciplined, transparent, and open to regular review.