

China Best Wine Suppliers with Low Carbon Footprint
Choosing a low-carbon wine supplier requires more than a sustainability label. Buyers need to understand where emissions arise, how they are measured, and whether supplier claims can be checked. The International Organisation of Vine and Wine (OIV) estimated global wine production at 237 million hectolitres in 2023, the lowest level since 1961. That scale makes practical improvements meaningful. It also makes clear comparisons important.
Life-cycle research by Amienyo and Azapagic, published in the International Journal of Life Cycle Assessment, examines emissions across wine production and consumption. It identifies packaging and distribution among the areas buyers should scrutinize. A heavy glass bottle, a long shipping route, and energy-intensive refrigeration each leave a measurable trail. No single figure fits every wine. The boundary of each calculation matters.
Wine-climate researcher Gregory Jones has said, “Climate is the most important factor in determining where wine grapes can be grown.” His observation speaks to the pressure vineyards face, while supplier choices can also reduce avoidable emissions. Here, wine carbon footprint means the greenhouse-gas impact associated with growing, making, packaging, and moving wine. The strongest suppliers can explain their methods, share evidence, and describe progress without implying perfection. Some data may still be incomplete. That deserves scrutiny, not dismissal. This guide compares China-based wine suppliers through practical questions: Do they track emissions? Can they document packaging choices? Are shipping and production claims specific enough to verify? The answers offer a more grounded starting point than broad “green” promises.
Understanding Low-Carbon Wine Supply in China
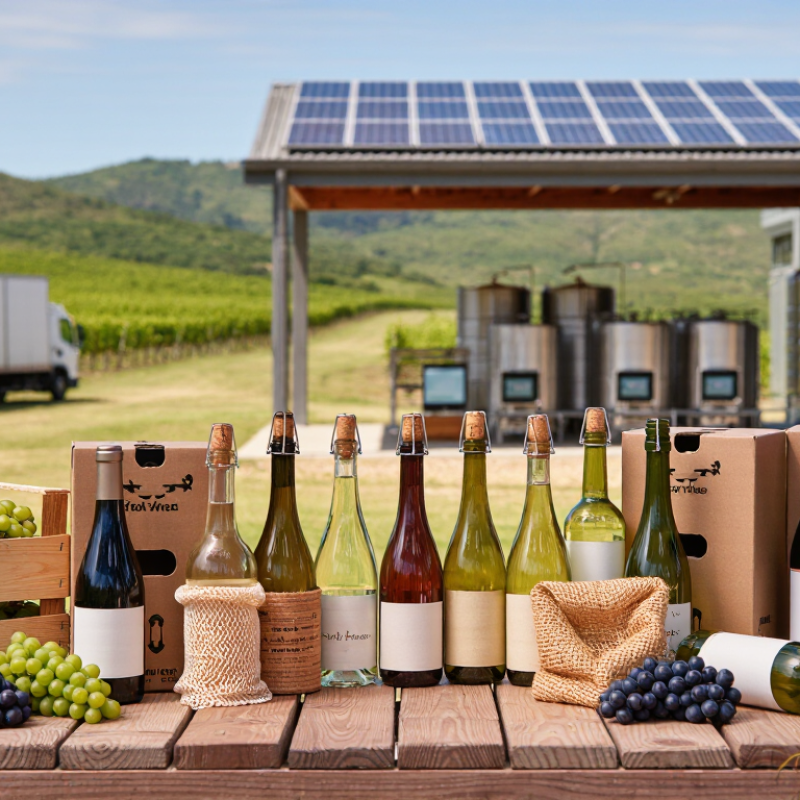
Understanding low-carbon wine supply in China means looking beyond a bottle’s label. Emissions can arise from vineyard energy, irrigation, glass production, storage, and delivery. A supplier’s location matters, but distance alone does not tell the whole story. A nearby shipment in a poorly filled refrigerated truck may use more energy per bottle than a longer, well-planned route. Small details matter.
Buyers can ask suppliers for practical records: bottle weight, packaging materials, electricity use, transport modes, and estimated emissions per case. These figures should state what they include and how they were calculated. Without clear boundaries, two suppliers’ numbers may not be comparable. Some businesses may have detailed data; others may only be starting to track it. That gap deserves honest discussion, not polished claims.
Packaging is a useful place to examine first. Lighter glass can reduce shipping weight, while protective cartons still need to prevent breakage during handling. Warehouses can also reduce unnecessary cooling when storage conditions allow. In China’s varied climate and distribution network, requirements may differ between regions and seasons. Ask how temperature is monitored, how orders are consolidated, and whether delivery records can be reviewed. The answers may be imperfect, but specific evidence is more useful than a broad “green” promise.
China Best Wine Suppliers with Low Carbon Footprint - Understanding Low-Carbon Wine Supply in China
This table is a supplier-assessment guide, not a ranking. Carbon performance varies by vineyard, winery, packaging, and shipment; no supplier-specific emissions or scores are assumed. Request site-level records to compare suppliers on a consistent basis.
| Supply-chain dimension | What to measure | Unit or reporting basis | Evidence to request | How it informs a low-carbon assessment |
|---|---|---|---|---|
| Vineyard operations | Fuel and electricity used for field work, machinery, and vineyard buildings | Energy by type and reporting year; emissions in kg CO2e per hectare or per litre of finished wine | Meter readings, fuel invoices, vineyard area, production records, and a documented emissions calculation | Shows the energy-related emissions associated with grape growing. Compare suppliers only when boundaries, units, and reporting periods match. |
| Fertilizer and soil inputs | Types and quantities of fertilizer and other nitrogen inputs applied | kg of product and, where available, kg of nitrogen per hectare per year | Purchase records, application logs, field area, and the calculation method used for soil-related emissions | Nitrogen inputs can contribute to agricultural greenhouse-gas emissions. Input records help make estimates more transparent. |
| Irrigation and water management | Water withdrawn or used for vineyard and winery operations, with pumping energy recorded separately | m3 per hectare for vineyards; m3 per litre of wine for winery operations | Water meters, irrigation logs, site boundaries, and electricity or fuel records for pumping | Water use is an important resource indicator. Pumping energy can be included in the greenhouse-gas inventory; water volume alone is not a carbon measure. |
| Winery energy | Purchased electricity and fuels used for crushing, fermentation, refrigeration, storage, and bottling | kWh and fuel quantities by year; kg CO2e per litre of wine | Utility bills, fuel records, production volumes, and the emissions factors used | Allows buyers to assess operational energy use and check whether renewable electricity claims are supported by appropriate records. |
| Packaging | Packaging type, material mass, recycled content, and packaging per sale unit | g per 750 mL bottle or kg per case; report each packaging component separately | Packaging specifications, supplier declarations, invoices, and recycled-content documentation | Packaging is a measurable part of the product footprint. A 750 mL bottle is a common wine-packaging format, but bottle weight and other materials vary by product. |
| Domestic and international logistics | Shipment distance, transport mode, load, and freight activity | tonne-kilometres (t·km) or kg CO2e per delivered case | Route records, bills of lading, shipment weights, transport modes, and freight-emissions methodology | Enables a like-for-like comparison of transport activity. Origin and destination alone are not enough to calculate shipment emissions. |
| Cold storage and distribution | Electricity used for refrigerated storage and any temperature-controlled transport | kWh per year or per case handled; kg CO2e per case where calculated | Warehouse energy records, storage duration, volume handled, and transport temperature-control records | Separates storage and distribution impacts from vineyard and winery operations. |
| Greenhouse-gas accounting | Inventory boundary, included emissions sources, base year, and recalculation policy | Annual inventory; report in t CO2e and state the product or organizational basis | Inventory report, calculation workbook, emissions-factor references, and independent verification statement if available | The GHG Protocol and ISO 14064-1 provide established frameworks for organizational greenhouse-gas accounting. Clear boundaries are essential for meaningful comparisons. |
| Product carbon footprint | Emissions across the defined life-cycle stages of a specified wine product | kg CO2e per declared functional unit, such as one 750 mL bottle | Product-footprint study, life-cycle boundary, allocation rules, data-quality notes, and verification details | ISO 14067 sets requirements and guidance for quantifying the carbon footprint of products. Results are comparable only when study boundaries and assumptions are disclosed. |
| China climate-policy context | National carbon-peaking and carbon-neutrality goals | Carbon dioxide emissions peak before 2030; carbon neutrality is aimed for before 2060 | Use official policy sources for context; assess individual suppliers using their own measured and documented data | These are national goals, not supplier-level certifications or proof that a particular wine product has a low carbon footprint. |
Related Posts
-
Top 10 Ways to Reduce Your Wine Carbon Footprint
-
Why Wine Carbon Footprint Matters to Global Buyers?
-

How to Reduce Your Wine Carbon Footprint in 2026?
-

2026 Top Trends in Paper Wine Packaging Now Making Waves?
-
Top Benefits of Wine in Paper Bottles for Eco-Friendly Consumers?
-
7 Tips to Reduce Your Wine Carbon Footprint